Load Testing Drupal: Introduction
At Web Performance, we’re all about measuring and optimizing web applications. This quarter we decided to test a variety of Drupal configurations, starting with the most basic (unpack the drupal tarball into /var/www and run) and collecting benchmarks with increasingly sophisticated systems using optimized LAMP stacks and even a dual-server caching configuration.
For our test scenario, we imagined that we had just started a small drupal-based blog when a popular website linked to one of our stories and directed massive traffic onto our server. These visitors read stories, followed interesting links, and posted comments of their own. We want to measure:
- How many simultaneous users can Drupal support under a given configuration?
- What is the bottleneck when Drupal does fail under load? (CPU, memory, etc)
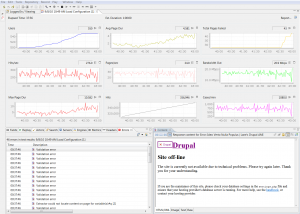
- How does Drupal behave or misbehave under load? (Do page durations increase? Do connections time out? Or do we get a graceful error message?)
For our purposes, we considered Drupal to be functioning adequately at a given user level if:
- Pages loaded, on average, in less then 4 seconds.
- It generated no errors.
- We detected no inconsistencies (e.g. users see their own user name while logged in).
Step 1: Server Configuration
We established a Drupal installation on the Amazon Elastic Cloud, which allows us to start and customize a Drupal installation in a matter of minutes. For these tests we used Amazon’s “Large” 64bit instance, which corresponds roughly to a dual-core machine with 7.5 GB of memory. We used a stock Fedora Core 8 with Apache and PHP5.
Step 2: Test Cases
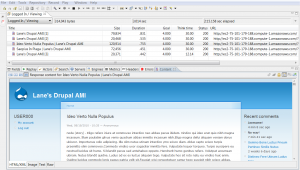
We needed to develop a suite of test cases that would be both realistic and easy to reproduce. To this end, we narrowed our test suite down to two variables: either the user is anonymous or logged in, and either the user follows a link to read more comments or posts a comment of her own. Although there are other functions that a user (or administrator) may perform, they usually amount to less than 1 percent of all transactions. Web Performance Load Tester allowed us to record our test cases and configure a wait times and unique user login/password pairs. We also configured Load Tester to validate responses from the server, meaning that Load Tester would monitor whether or not the information returned from the server was consistent with what a user would expect to see.
Step 3: Load Testing
We then configured Web Performance Load Tester to launch several remote load engines, dedicated servers or Amazon cloud instances that generate traffic to our Drupal instance. We configured our load test to ramp up, starting with a very small number of users and increasing over time until our Drupal server fell apart under load. Load Tester randomizes the timing of the tests and collects metrics on relevant statistics such as page durations, number of errors, and bandwidth. In a well performing system, bandwidth scales with the number of users, page durations remain roughly constant, and the number of errors is zero.
Step 4: Analysis
Once our load test is complete, we import Web Performance Advanced Server Analysis Agent logs. These logs contain counters for CPU usage, memory, disk I/O and other pertinent metrics. Load Tester correlates all of these metrics by user level and time index. When we saw that our baseline Drupal installation exhibited 100% CPU usage and spiking page durations at 200 simultaneous users, we knew that the system was limited to about 150 users and that we needed to optimize Drupal to be less processor-intensive.
Step 5: Results
We were able to improve the performance of our baseline installation by more than 10 times! To learn more, read our follow-up articles:
- Drupal Case Studies part 2: From baseline Drupal to the Pantheon Drupal Platform
- Drupal Case Studies part 3: aiCache and Drupal
— Lane, Engineer at Web Performance


