Google Pagespeed Scalability Benchmark
Premise
Google Pagespeed is an easy way to optimize web page rendering time without having to recode your website. The pagespeed analyzer gives suggestions on what needs to be changed, while mod_pagespeed is an Apache add-on that makes those modifications automagically.
The one question that hasn’t been answered is “what is the performance cost for installing mod_pagespeed”. Pagespeed addresses only client-side performance, which is completely different from server scalability. The actual page load times that customers see in practice is affected by both the page design and layout, and the actual speed of the server under load. This is a little project to take a look at what happens when a mod_pagespeed equipped Apache web server encounters load.
What You’re Getting
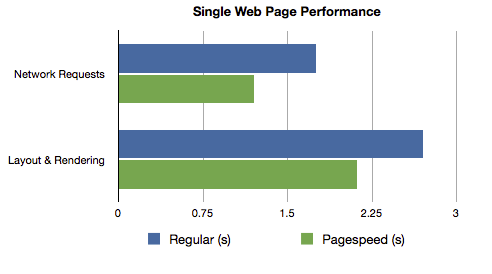
To start off, let’s take a look at what mod_pagespeed did to the web pages when the server is accessed by a single user. Without optimization our homepage got a score of 77/100, with dozens of suggestions for changes. (Our site is laid out to be easy to edit and maintain rather than being optimized for maximum performance.) With mod_pagespeed turned on, the score jumped to 95/100. Looking at the analysis, it appears that mod_pagespeed mainly changed the caching settings and combined images into CSS sprites.

In the above chart the network requests run concurrently with page rendering, so the perceived improvement in both network transfer time and page render time is around 20%, which isn’t bad for simply installing an Apache module. The question is, how long does this performance improvement last when the server is subjected to load? This question is somewhat difficult to answer since under load the render time isn’t available, so we use “load times”, which is the time it takes for all of the content to be loaded across the network.
This is valid for load comparisons because load times represent the vast majority of the perceived time it takes for the user to view the page. On top of that, its impossible to actually measure render time because of the subjectivity involved. Does the user perceive that the page has rendered when 80% is rendered? 90% For many pages the user considers the page rendered when the part they’re reading is finished, and the parts that are uninteresting (below the fold for example) don’t matter.
Performance under Load
The test I set up compared a typical high-performance Apache configuration, with file caching and the typical httpd.conf modifications. (Details will be provided at the end of the post.)
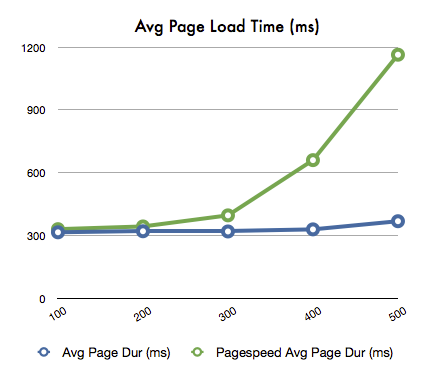
The following chart compare web page load times between this typical optimized Apache2 installation, and the same installation with mod_pagespeed installed. When mod_pagespeed was turned on, the web page load times quickly doubled, so that by somewhere around 300 to 400 concurrent users the advantages of running mod_pagespeed were outweighed by the overhead in running the module.

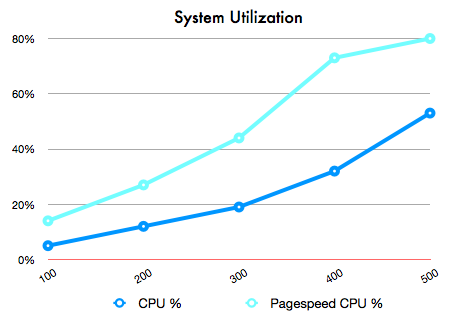
The reason appears to be additional system load from mod_pagespeed, which is roughly double over a non-optimized system. The system was definitely not I/O bound, as I’ve benchmarked the EC2 to EC2 bandwidth of this virtual server to be around 600Mb/s, and these tests topped out at only 200Mb/s.

Recommendations
The test was designed to zero in on the effects of mod_pagespeed, but in real life your site is likely to be dynamic, not static. As such, these results may or may not apply to you; the only way to tell is to do the experiment on your own site. However, if your site has many static pages, the obvious conclusion is that mod_pagespeed makes sense to install only if your site is lightly loaded, and you can verify that the modified pages are actually faster than the default pages. In my case there was about a 20% speedup, which was noticeable. You’ll want to check that all dynamic pages and scripts function however, since mod_pagespeed broke our shopping cart, and there could possibly have bad interactions with dynamic parts of your site as well.
The obvious best practice here is, if absolute page load times are important, then it is worth it to take the time to make the recommended Google Pagespeed changes by hand; that way you retain the full power of the server.
Reproducing the Results
The server I used to test was an EC2 m1.large virtual server running Red Hat Enterprise Linux Server release 6.3 (Santiago). The mod_pagespeed module was installed via yum and used version mod-pagespeed-stable.x86_64 1.1.23.2-2258. Apache was configured to use mod_disk_cache and the following pre-fork MPM settings:
StartServers      20

MinSpareServers   25

MaxSpareServers   100

ServerLimit      8192

MaxClients       8192

MaxRequestsPerChild  10000
The test case consisted of these three pages from our site with the PHP removed so that PHP didn’t enter into the performance equation, configured for think times of 4 seconds and connection speeds of 5Mb/s:
https://www.webperformance.com

https://www.webperformance.com/load-testing-tools

https://www.webperformance.com/load-testing-services
Note that I tried to use the worker MPM but could not get it to run with mod_pagespeed without crashes. You’ll want to be sure to apply these ulimit changes as well.
Michael Czeiszperger
Web Performance, Inc.

Founder of Web Performance, Inc
B.S. Electrical & Computer Engineering
The Ohio State University
LinkedIn Profile
5 Comments
7 December 2012 jmarantz
Thanks for the report. Couple of questions:
1. Which version of mod_pagespeed did you use? Check
response-headers for X-Mod-Pagespeed to find out for sure.
2. Do you know whether your server was I/O bound or CPU bound?
3. Can you share the web-page you used for the benchmark
4. The default mod_pagespeed caching setup uses disks for
both caching and locking. That is not the most perforrmant
setup, and I’d guess on EC2 it might be worse since the
machine is Virtual. For caching, can you try using either
memcached https://developers.google.com/speed/docs/mod_pagespeed/system#memcached
or using a tmpfs to put your cache in RAM:
https://developers.google.com/speed/docs/mod_pagespeed/faq#tmpfs
For locking can you use shared-memory locks:
https://developers.google.com/speed/docs/mod_pagespeed/system#shm_lock_manager
It would be a great case study to see how these impacted your tests.
Thanks!
-Josh
7 December 2012 Michael Czeiszperger
Hi Josh–
Thanks for taking the time to read my article! I updated the article to answer your questions 1-3, as other people may have been wondering the same things. I’ll try out your recommendations, but caching isn’t as simple as you’d think. Ostensibly disk-based caching would be slower than memory caching, especially on a virtual system. What we’ve found, though, is that Linux will cache the files in memory, and the resulting performance is faster than Apache’s actual memory-based cache.
Anything can happen, though, so I’ll give your suggestions a try and see what happens!
7 December 2012 jmarantz
mod_pagespeed supports the Worker MPM and we load-test with it. Can you give details on the crashes at https://groups.google.com/forum/?fromgroups#!forum/mod-pagespeed-discuss or http://code.google.com/p/modpagespeed/issues/list
I’ll take a look at your web pages to see what the working set looks like.
BTW mod_pagespeed definitely does add overhead: it parses the HTML on every request (figure ~10ms per HTML request), though it caches the resource optimizations. So it doesn’t matter much whether the page is statically generated or dynamic. The bulk of the CPU time at startup is typically in image compression, but once an image is cached, that should no longer be a factor.
The other question about caching is how large your mod_pagespeed file-cache is, and whether during your load-test we are evicting anything. Your pages don’t look that large, though so I’m guessing you are running purely out of disk-cache in which case you might just be seeing the HTML parsing overhead. We can definitely work on improving the speed of that but it hasn’t boiled to the top of the priority list.
One last question about your jmeter load-test set up. Are you fetching resources on the page? Or just the HTML files? The real load include both, and mod_pagespeed should serve already-optimized resources from its cached reasonably quickly. Part of the principle also is that with 1-year cache lifetime your server will spend less time serving resources than what you’d typically want to set if you were manually setting TTLs to allow site changes to propagate in a reasonable amount of time. That won’t come out in a load-test, however, because your existing TTL is probably longer than a load-test.
I do want to make one editorial comment. The conclusion that you should manually apply optimizations that can be done by machine is the right one for some sites. Other sites might find it makes more sense to add server resources to reduce manual labor, as Moore’s law surely favors having machines do more work 🙂
Moreover, if you are not using some automated mechanism to sign URLs based on content or source-control version, then you have to trade off your ability change it vs browser cacheability, whereas with mod_pagespeed & other WPO tools you get the best of both worlds.
7 December 2012 jmarantz
As Kishore mentioned on https://groups.google.com/forum/?fromgroups#!forum/mod-pagespeed-discuss , there is more benefit to mod_pagespeed than just the default setup. In particular, defer_javascript can be very impactful to the rendering speed.
So can lazyload_images, convert_jpeg_to_progressive, and convert_jpeg_to_webp. mod_pagespeed is conservative about putting those aggressive options into the core-filters, but most sites will look identical using those filters, and perform much better.
We also recommend trying:
ModPagespeedImageRecompressionQuality 85
This doesn’t directly address your point that it can affect server load, but it perhaps offers additional value on the other side of the equation.
12 December 2012 Michael Czeiszperger
“One last question about your jmeter load-test set up. Are you fetching resources on the page? Or just the HTML files?”
We use our own load testing software that is greatly superior to JMeter 🙂 Yes, it simulates download of the entire page.
I re-ran the tests using the suggested shared-memory lock and compression quality set to 85, and saw a measurable improvement over the base measurement… A detailed report will follow shortly.